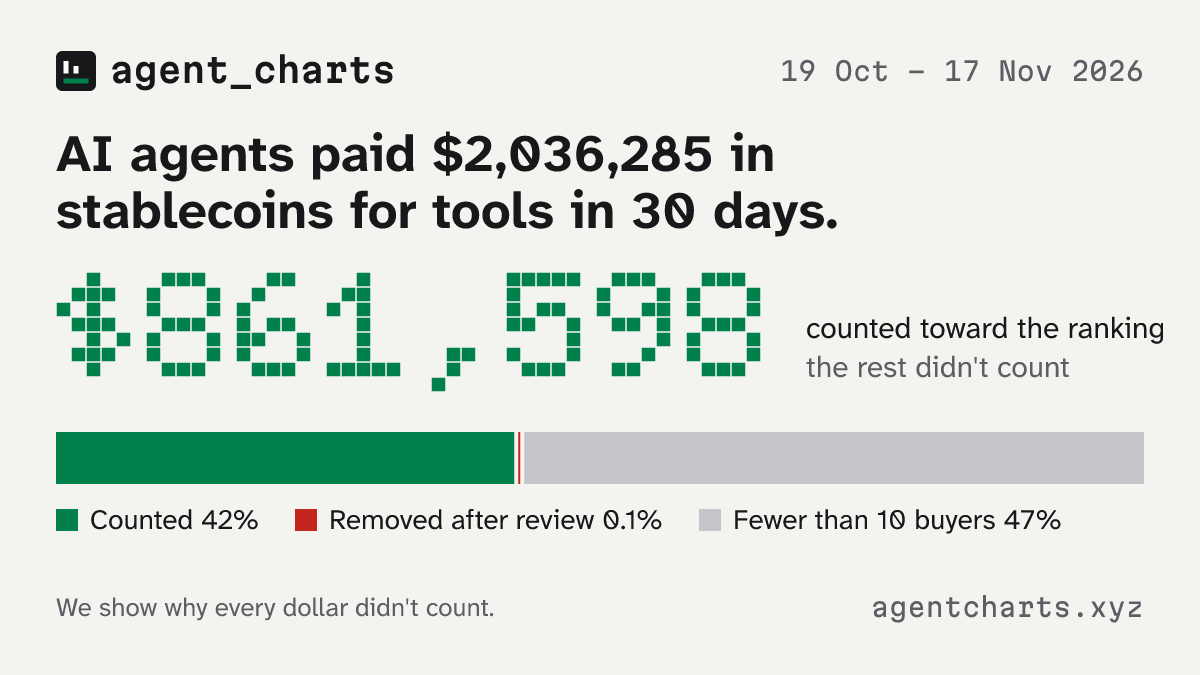
AI agents paid $2,036,285 in stablecoins for tools in the last 30 days.
Counted toward the ranking, 19 Oct – 17 Nov 2026
$861,598
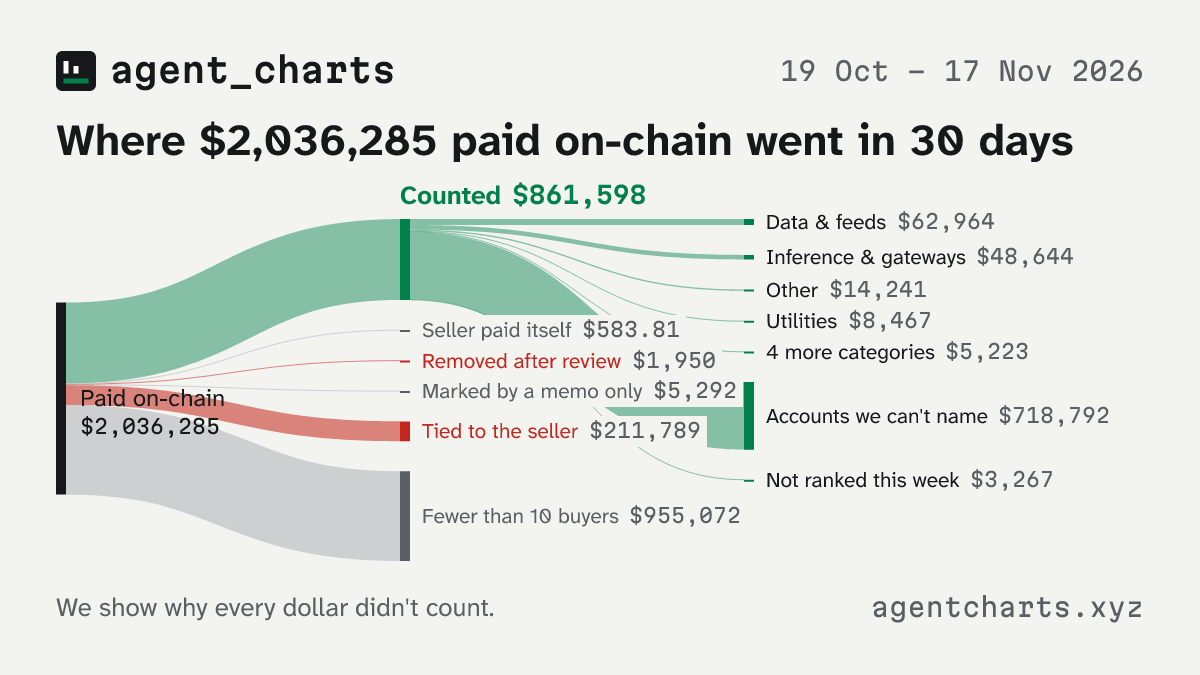
The other $1,174,687 didn't count: $955,072 went to sellers with fewer than 10 buyers, $1,950 to nine sellers we removed after checking them, $211,789 from wallets tied to the sellers they paid, $5,292 marked by a memo only, and $584 to sellers paying themselves. Of the money that counted, $139,539 went to the 576 sellers ranked below, $718,792 to accounts we can't match to a seller, and $3,267 to sellers not ranked this week.
- Sellers ranked
- 576
- Buyers
- 31,984
- Paid calls
- 5,668,623
Paid in digital dollars and euros: USDC $858,265, USDC.e 3,235 ($3,235), OUSD 97.02 ($97.02), EURC €0.90 ($1.01). We only see stablecoin payments on-chain, so card payments and other methods aren't included.
Explore the data: any period, any category →
Share this week:XLinkedInDownload image
Week 47 receipt
30 days to 17 Nov 2026
Paid on-chain$2,036,285
− Fewer than 10 buyers−$955,072
− Tied to the seller−$211,789
− Marked by a memo only−$5,292
− Removed after review−$1,950
− Seller paid itself−$583.81
− Tiny test payments−$0.0833
= Counted$861,598
of which to accounts we can't name$718,792
40 dots, each 2.5% of the money: green counted, red was removed after a review, and grey didn't count under our rules.
Behind this week's numbers
- Where the $955,072 to sellers with fewer than 10 buyers went One payer sent 81% of it.
- Which sellers were removed after review, and why 9 this week, $1,950; every removal so far.
- How much do AI agents actually spend? The short answer
- This week's report as published
Number one in each category
Buyer spread splits each seller's 30-day money into tenths: the biggest buyer, buyers 2 to 10, everyone else.
| Category | Number one | Spent in 30 days | Buyers | Buyer spread | Weeks on the chart | Change |
|---|---|---|---|---|---|---|
| Data & feeds |  ax1.vcBase | $53,030 | 9,316 | top buyer 3% | 11 weeks, 9 at #1 | – |
| Inference & gateways |  dtelecom.orgBase | $36,336 | 29 | top buyer 9% | 27 weeks, 21 at #1 | – |
| Other |  clashofcoins.comBase | $6,710 | 660 | top buyer 3% | 35 weeks, 17 at #1 | – |
| Utilities | api-xpay.comBase | $6,024 | 318 | top buyer 7% | 10 weeks, 7 at #1 | – |
| Scraping & extraction |  oneshotagent.comBase | $1,483 | 89 | top buyer 91% | 24 weeks, 5 at #1 | – |
| Web search |  pocket.networkBase · Tempo | $622.00 | 191 | top buyer 7% | 9 weeks, 5 at #1 | – |
| Browser & compute | ardrive.ioBase | $614.54 | 111 | top buyer 81% | 9 weeks, 8 at #1 | – |
| Social & comms |  glim.shBase · Solana · Tempo | $259.89 | 140 | top buyer 41% | 24 weeks, 11 at #1 | – |
Where the money went
From every payment to the ranking. Grey didn't count under our rules, red was removed after a review, and green counted, split by category. How it works
Scroll sideways to see the whole chart.
- Data & feeds$62,964 · 7%
- Inference & gateways$48,644 · 6%
- Other$14,241 · 2%
- Utilities$8,467 · 1.0%
- Scraping & extraction$2,599 · 0.3%
- Web search$1,447 · 0.2%
- Browser & compute$653.48 · 0.1%
- Social & comms$522.98 · 0.1%
- Accounts we can't match to a seller$718,792 · 83%
- Sellers not ranked$3,267 · 0.4%
Another 1,535 named sellers had fewer than 10 buyers, $6,575 between them, and aren't ranked. Where all $955,072 to sellers with fewer than 10 buyers went
Share this chart:XLinkedInDownload image
Week by week
13% of the money counted in the week to 11 Jan 2026, 74% in the week to 15 Nov 2026.
Movers
Change in 30-day spend since last week.
- ax1.vcBase▲ +$12,179
 blockrun.aiBase · Solana▲ +$1,172
- clashofcoins.comBase▲ +$592.17
 bitrefill.comBase · Solana▼ −$223.84
- dtelecom.orgBase▼ −$107.00
 exa.aiBase · Solana · Tempo▼ −$56.33
New this week
Ranked for the first time, with the day we first kept their money.
 realtimeapi.aiBase9 Nov 2026
 agentsearchhq.comBase10 Nov 2026
- incomefather.comBase9 Nov 2026
 tradytics.comBase12 Nov 2026
 gtxagent.comBase10 Nov 2026
Most paid category: Data & feeds · top 5 sellers
Buyer spread splits each seller's 30-day money into tenths: the biggest buyer, buyers 2 to 10, everyone else.
| # | Seller | Spent in 30 days | Buyers | Buyer spread | Paid calls | Typical price per call | Change |
|---|---|---|---|---|---|---|---|
| 1 | ax1.vcBase | $53,030 | 9,316 | top buyer 3% | 2,685,663 | $0.02 | – |
| 2 |  laso.financeBase · Solana | $3,449 | 99 | top buyer 28% | 625 | $0.001 | – |
| 3 |  stableenrich.devBase · Solana · Tempo | $1,861 | 370 | top buyer 35% | 93,205 | $0.01 | – |
| 4 |  zerion.ioBase · Solana · Tempo | $574.58 | 54 | top buyer 41% | 57,458 | $0.01 | – |
| 5 |  arkm.comBase · Solana | $387.80 | 48 | top buyer 42% | 1,385 | $0.20 | – |
Guides
- For sellers
- Claim your listing · Get your tool counted · Why isn't my tool ranked?
- Building an agent?
- Pick a paid tool for your agent · Agent Charts for agents
- Quoting us?
- Cite Agent Charts · Why x402 numbers differ